Bitcoin is breaking a midterm election pattern going back to 2014
Source: CoinDesk ·
From the source
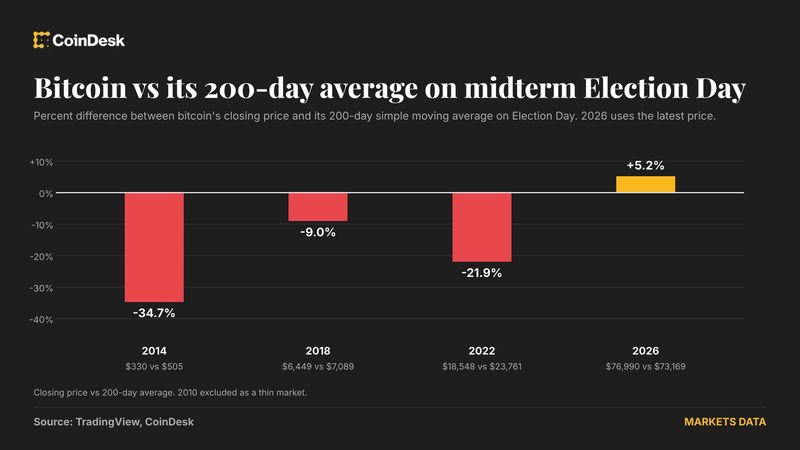
Your day-ahead look for Nov. 3, 2026 This is an excerpt from CoinDesk newsletter 'Daybook.' Sign up here , if you haven't already. Bitcoin BTC $77,245.33 has gone into each of the last three US midterm elections licking its wounds. This time is different. How? Look at where bitcoin’s price is relative to its 200-day average, a widely-tracked barometer of long-term market trends. As of this writing, BTC traded near $76,990, about 5.2% above its 200-day average of roughly $73,169. An asset trading above its 200-day average is said to be in a long-term bullish trend. In 2014, 2018 and 2022, the situation on the midterm election day was the opposite, as bitcoin traded below the average, by about 35%, 9% and 22% respectively. These three years were bear market years, consistent with the four-year halving cycle, which sees bitcoin peak roughly 18 months after a halving and then drop into a year-long bear market. 2026 was supposed to be the same after BTC peaked above $126,000 in October…
BestAIBroker analysis
- Finance-aware sentiment: neutral (+0.00 on a -1 to +1 scale).
- Event classification: OTHER.
- Market importance score: 27/100, weighting entity relevance, source credibility, multi-outlet coverage and recency.
- Symbols referenced: BTC.